
Three altcoins are entering next week with fresh bullish setups on their daily charts. DeXe (DEXE) leads with a 63.8% weekly gain, while Ethena (ENA) and MemeCore (M) show technical breakouts that suggest follow-through upside.
Each chart shows a distinct setup. DEXE has cleared a key Fibonacci retracement with strong momentum, ENA has broken a multi-month downtrend line, and M is riding an exponential support curve above a confirmed breakout zone.
Altcoin to Watch: DeXe Leads the Week With a 64% Rally
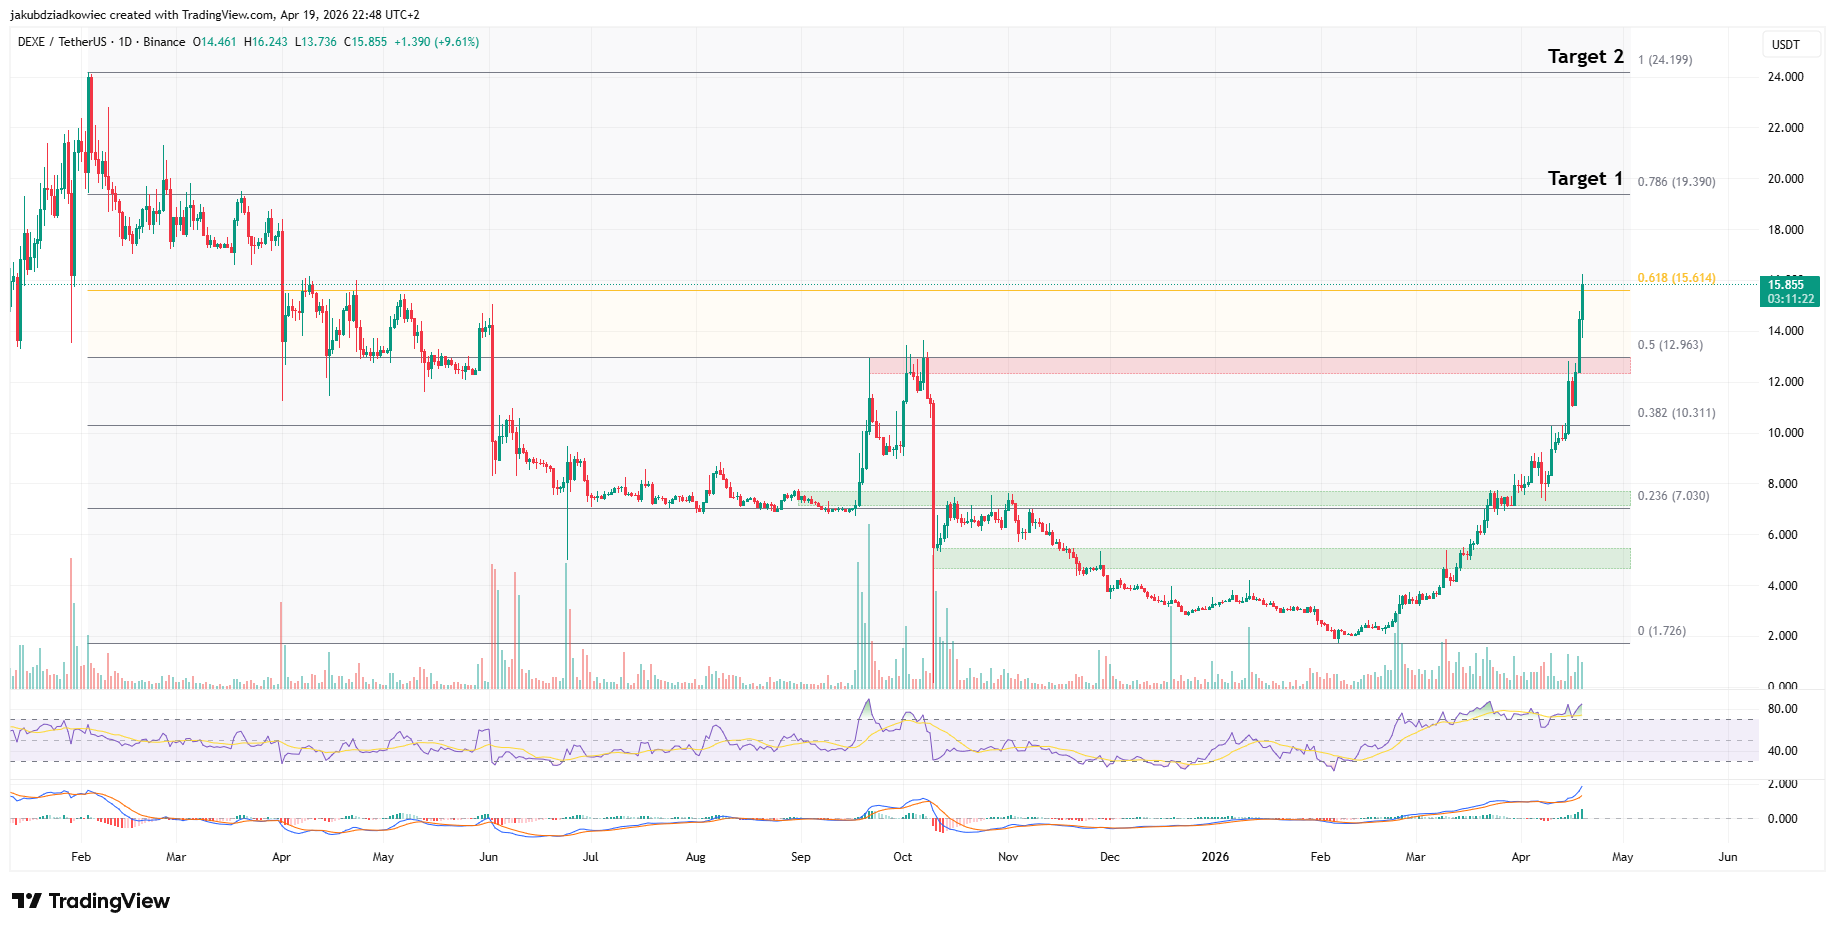
DeXe (DEXE) is the strongest performer on this watchlist, up 63.8% over the last seven days. Nearly 10% of that gain came in the last two sessions, with price trading at $15.85 and sitting directly on the 0.618 Fibonacci retracement at $15.61.
The coin has already cleared the $12.50 to $13 resistance zone, a level flagged in prior DeXe coverage. That area now acts as the first support if buyers step back.
The next major target on the upside is the 0.786 retracement at $19.39. Above that level, the chart shows a final target at the 1.0 retracement near $24.20, which would mark a full recovery to the February 2025 high.
Moving Average Convergence Divergence (MACD) remains elevated and positively sloped, which continues to support momentum. However, the Relative Strength Index (RSI) has reached the upper band and is showing the first hints of bearish divergence, a shift that could signal cooling ahead.
Volume has been declining across the advance, a typical sign that the move lacks fresh participation. The uptrend could stall if new buyers do not step in at higher prices.
If momentum reverses, the first downside target is $13. The second support sits at $10.31, which is the 0.382 Fibonacci retracement and the line that would define a deeper correction.
Ethena Breaks a Multi-Month Downtrend Line
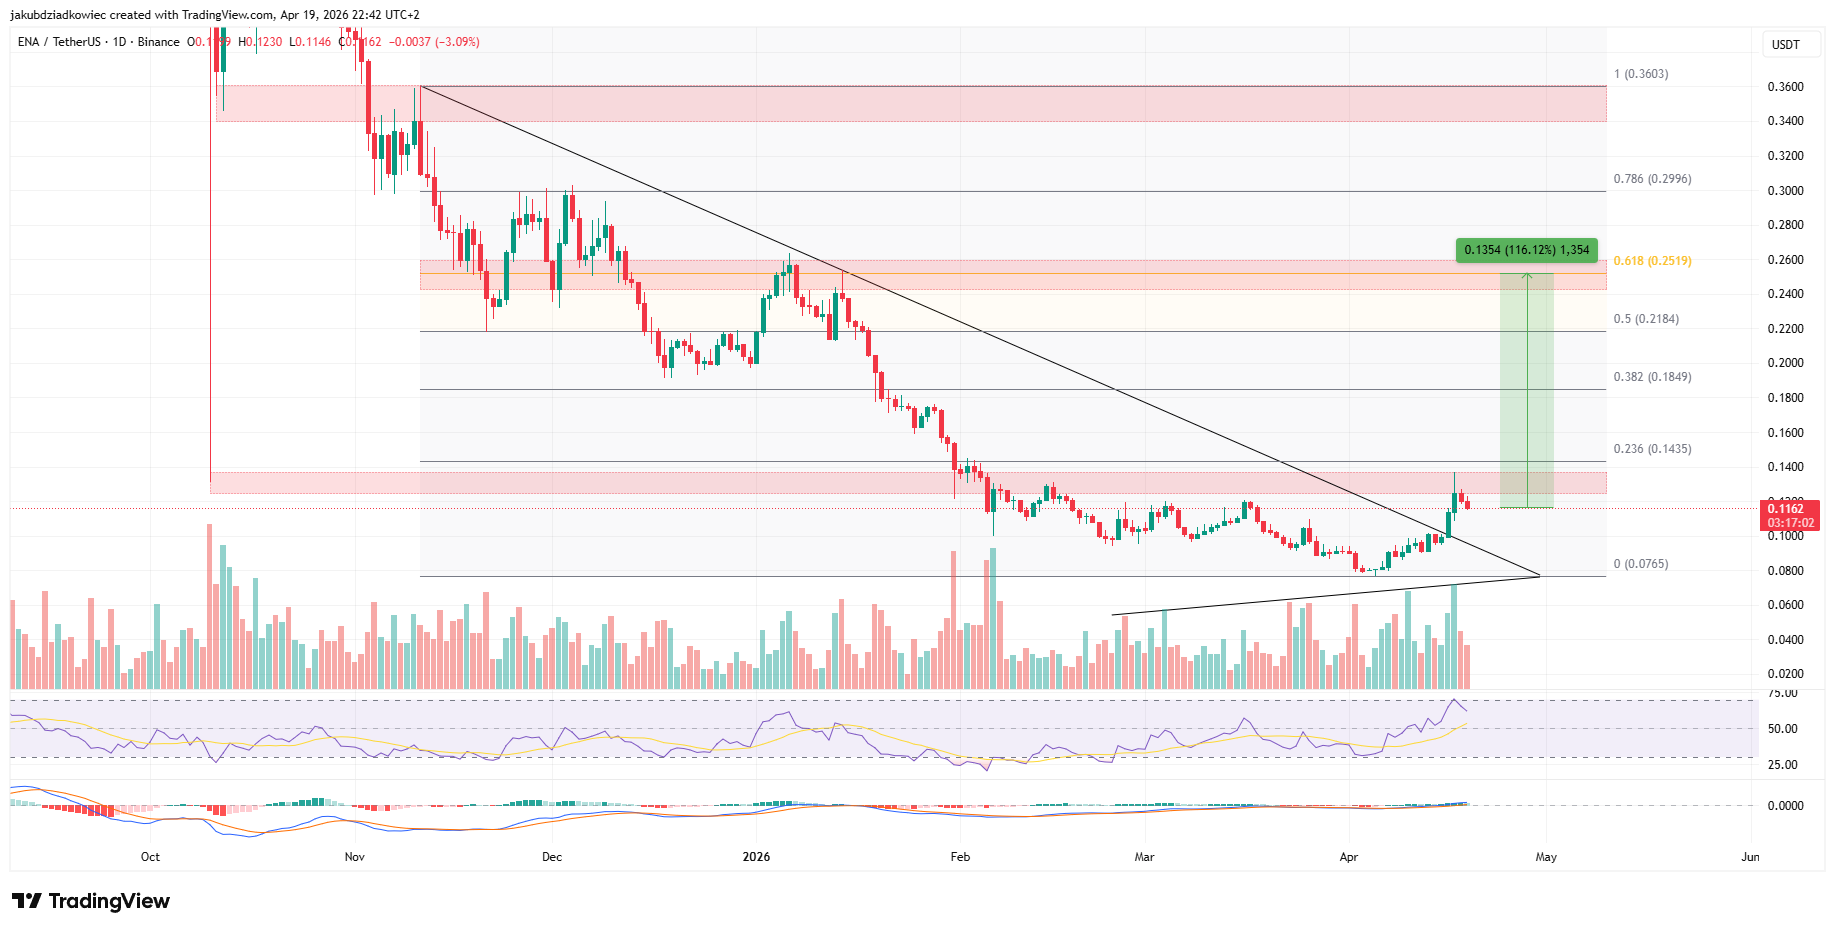
Ethena (ENA) has gained 27.1% over the past week, the second-strongest performer on this list. Price trades near $0.1162 after a short-term pullback on the day, yet the weekly structure remains constructive.
Three days ago, the price pushed above a descending trend line. That line had guided the full move from the November 11 high at $0.3603 into the April 5 low at $0.0765.
The Fibonacci retracement anchored from those two points places the first resistance at $0.1435, which is the 0.236 level. Price is consolidating just below that zone, which is marked in red on the chart.
A confirmed close above $0.1435 would open the 0.382 retracement at $0.1849 and the 0.5 retracement at $0.2184. The 0.618 retracement at $0.2519 remains the primary target for a larger breakout. That level would represent a 116% gain from current prices (green).
Volume has been rising on bullish candles, signaling stronger buyer participation. RSI has climbed out of oversold without reaching overbought, which leaves room for further upside. Other altcoins have shown similar recovery setups heading into April.
The final bullish target sits at $0.3603, the breakdown zone from November. That path is ambitious, yet the chart no longer prints fresh lower lows, and the break of the trend line is the first structural shift in months.
MemeCore Holds Breakout Support After a 24% Weekly Gain
MemeCore (M) posted a 24.2% gain over the last seven days, rounding out this week’s three altcoins. The token broke out of a multi-month resistance zone on April 16 and has since converted that zone into support.
That resistance had capped gains since September 17, 2025. It now sits between $2.80 and $3.00 on the daily chart, and a retest on April 19 confirmed the area as support.
An exponential curve drawn on the chart (black) continues to track the price from below. A break of that curve would be the first clear sign that the trend structure has shifted.
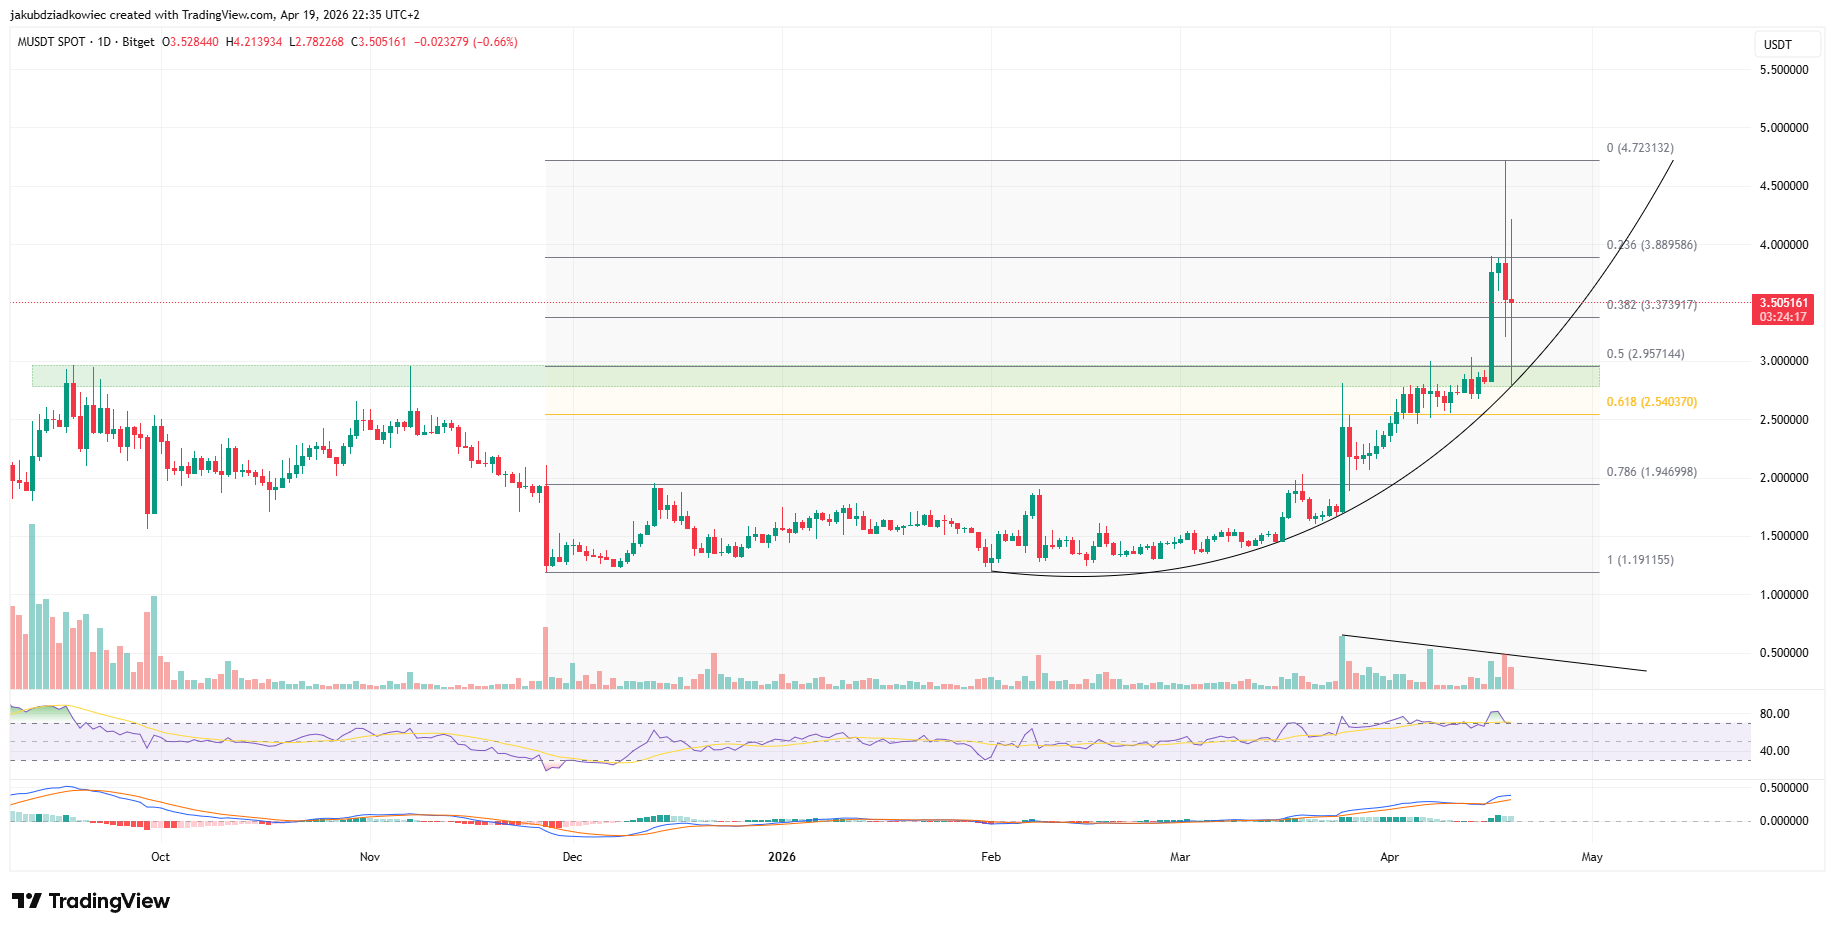
The most recent pullback tagged the 0.5 Fibonacci retracement, which sits inside the same support band. A deeper correction would shift attention to the 0.618 retracement near $2.54, the last defense for the bullish thesis. Prior MemeCore coverage tracked a similar breakout attempt earlier this cycle.
RSI shows no bearish divergence, and MACD remains constructive. Volume has been trending lower even as price extends, a divergence that suggests the rally needs fresh buyers to sustain the current pace.