XRP (XRP) is trading near $1.43 as multiple timeframes point to an imminent directional move, with a cup and handle on the 4-hour chart targeting $1.70 and a confirmed weekly golden cross backing a longer-term bullish thesis.
Daily volatility has compressed to near record lows while the Relative Strength Index (RSI) tightens inside a triangle stretching back to mid-2025. The setup resembles a classic accumulation phase before a powerful expansion.
XRP Weekly Channel and Golden Cross Build Macro Bullish Case
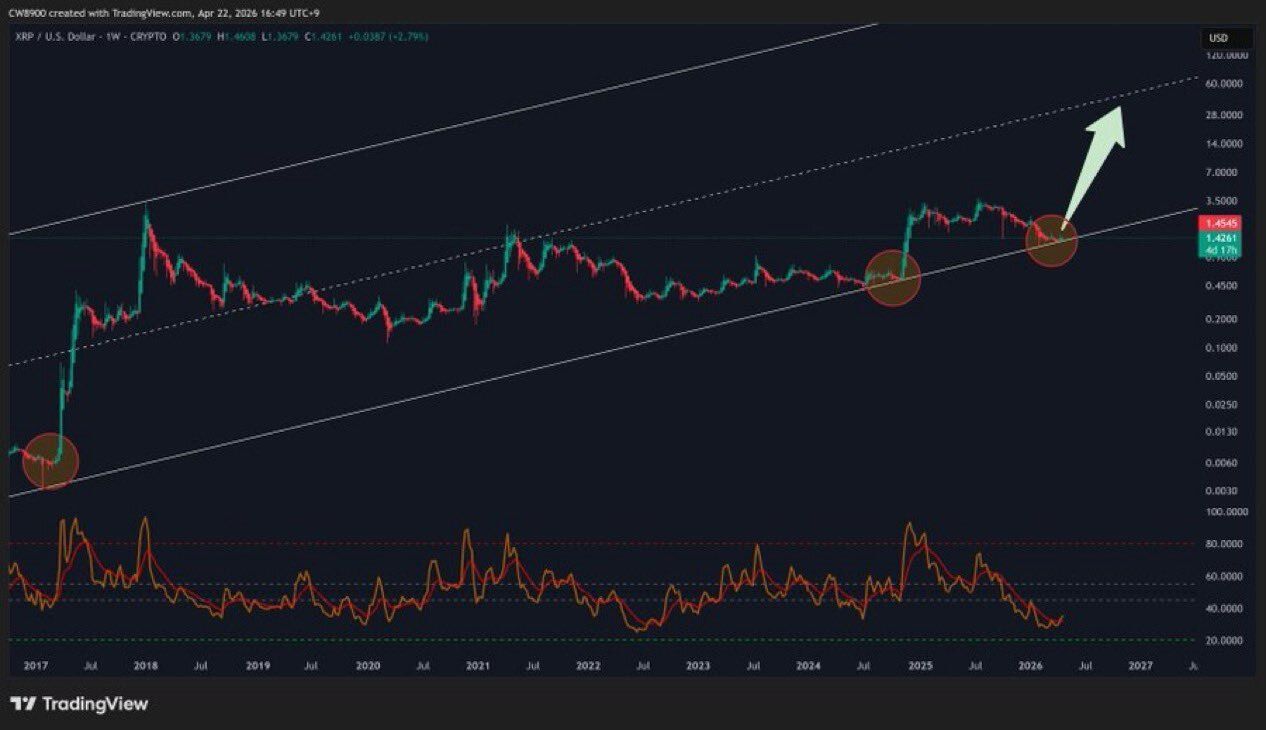
The weekly XRP chart shows the price on the lower boundary of an ascending parallel channel drawn on a logarithmic scale. The current bounce marks the third test of that support. Historically, prior tests in 2017 and mid-2024 preceded strong rallies.
A confirmed golden cross adds weight to the structure. Weekly golden crosses are rare and have marked sustained uptrends in past cycles. Crypto analyst XrpUdate expects XRP to run toward the channel midline, which currently sits in the $30 range.
Meanwhile, a clean loss of the channel support would invalidate the bullish case. Such a breakdown could open the door for a return to cycle lows.
“$XRP JUST CONFIRMED A GOLDEN CROSS Years of consolidation → ready to expand. The structure is screaming continuation. This is where smart money loads…”
Daily Volatility Collapse and RSI Triangle Point to Expansion
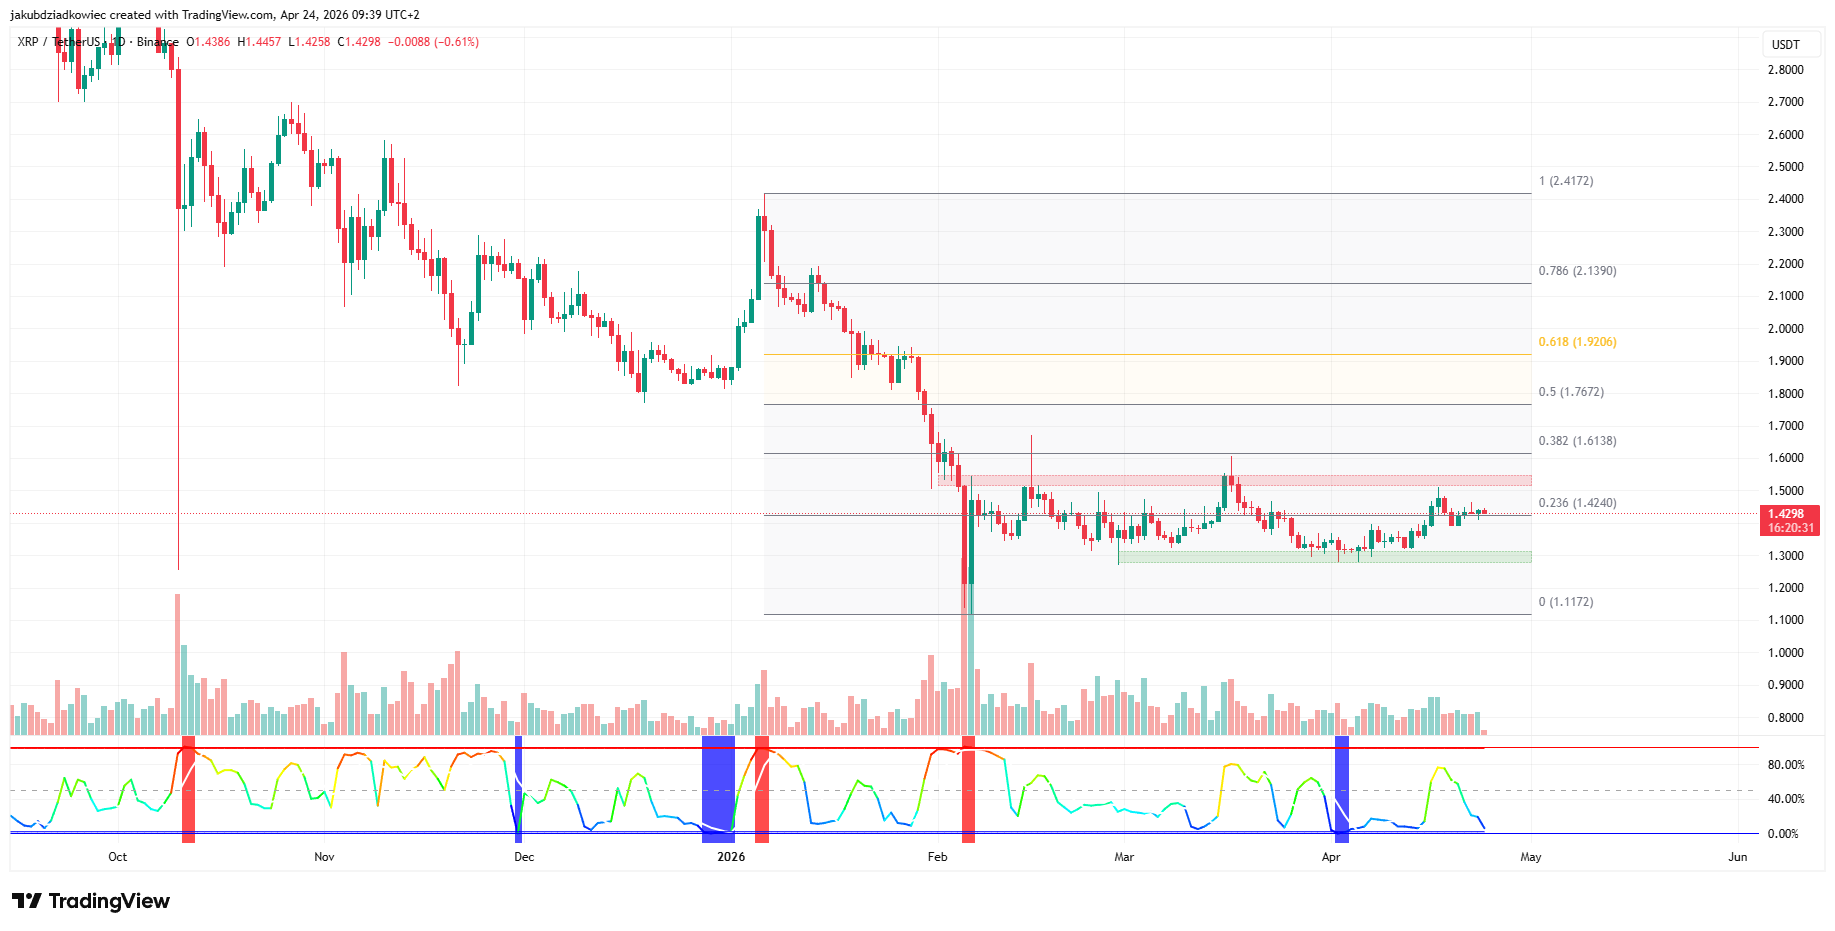
The daily chart shows XRP pinned to the 0.236 Fibonacci retracement at $1.42. Support sits at $1.30, and resistance at $1.53. The Fibonacci grid is anchored to the January rally top at $2.42.
Beneath the price panel, the Bollinger Band Width Percentile (BBWP) reading has collapsed toward zero and is flashing blue. Volatility this compressed has historically preceded sharp directional moves in either direction.
Declining volume through April reinforces the accumulation thesis. Long-term holders tend to absorb supply quietly during these phases before retail catches on.
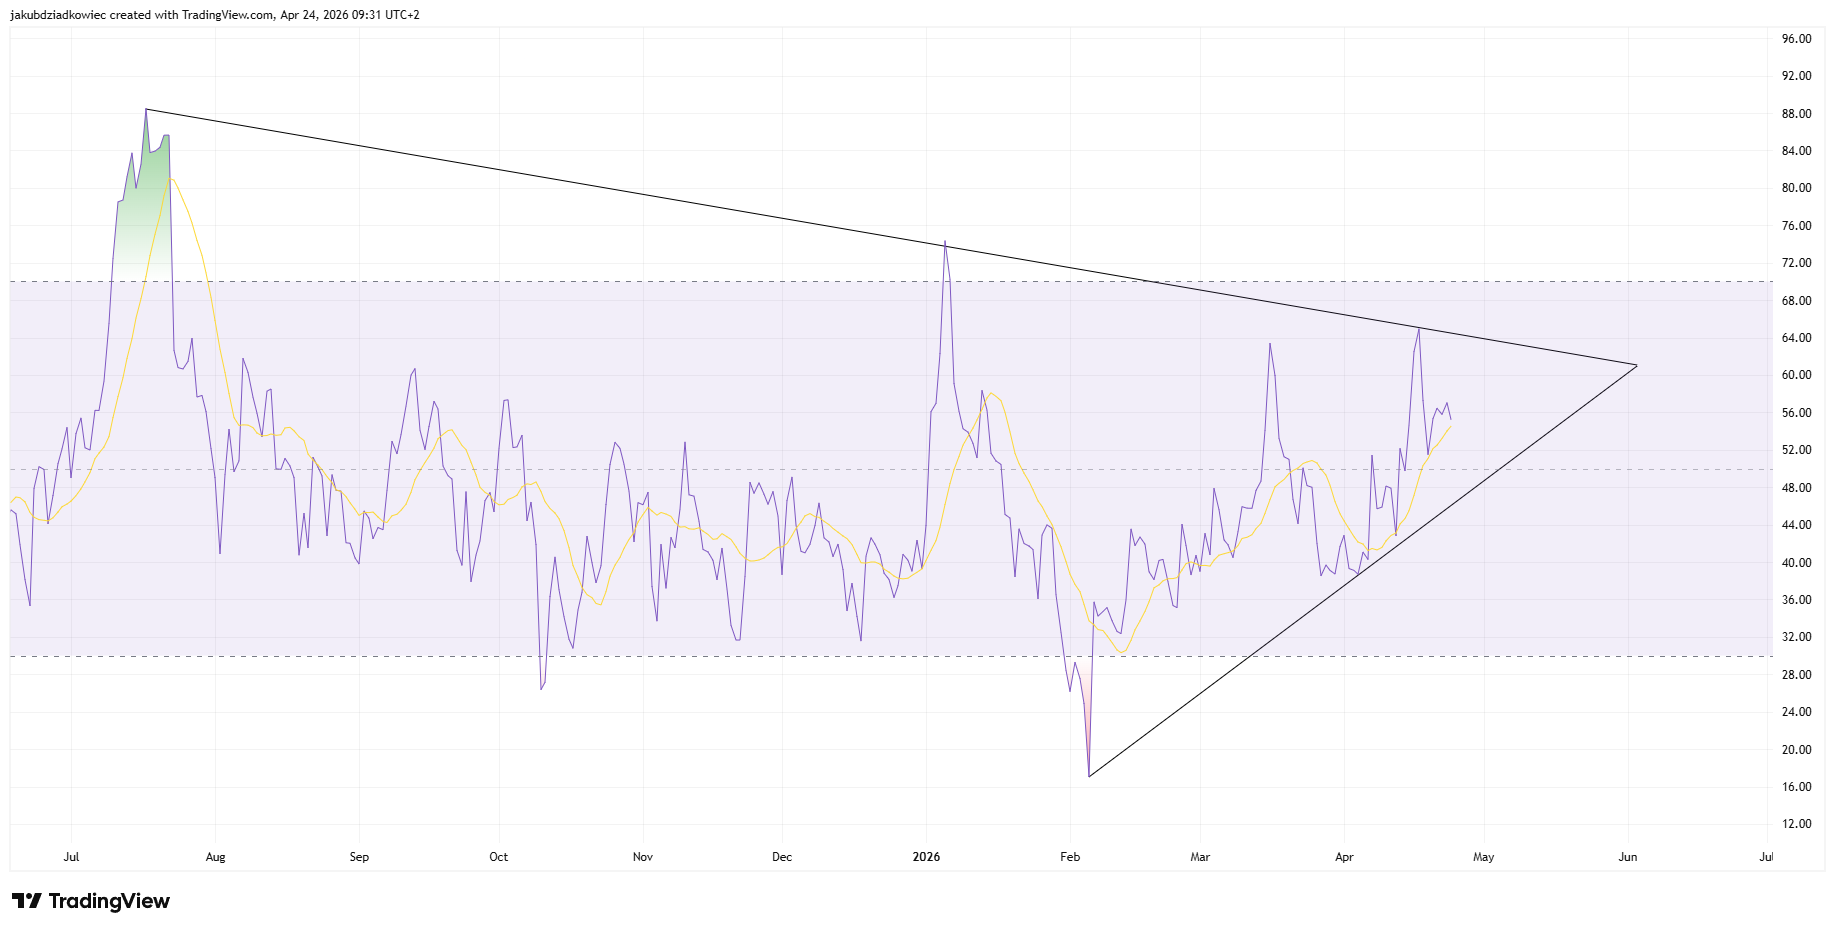
Confirming the setup, the daily RSI has formed a contracting triangle since July 2025. Resistance slopes down from the 88 print last summer. Support rises from the February 2026 low near 18.
The indicator currently sits around 55, almost dead-center inside the apex. A break above 60 would align with a bullish momentum shift. However, a drop under 45 would warn of further downside.
XRP Price Prediction and the $1.70 Cup and Handle Target
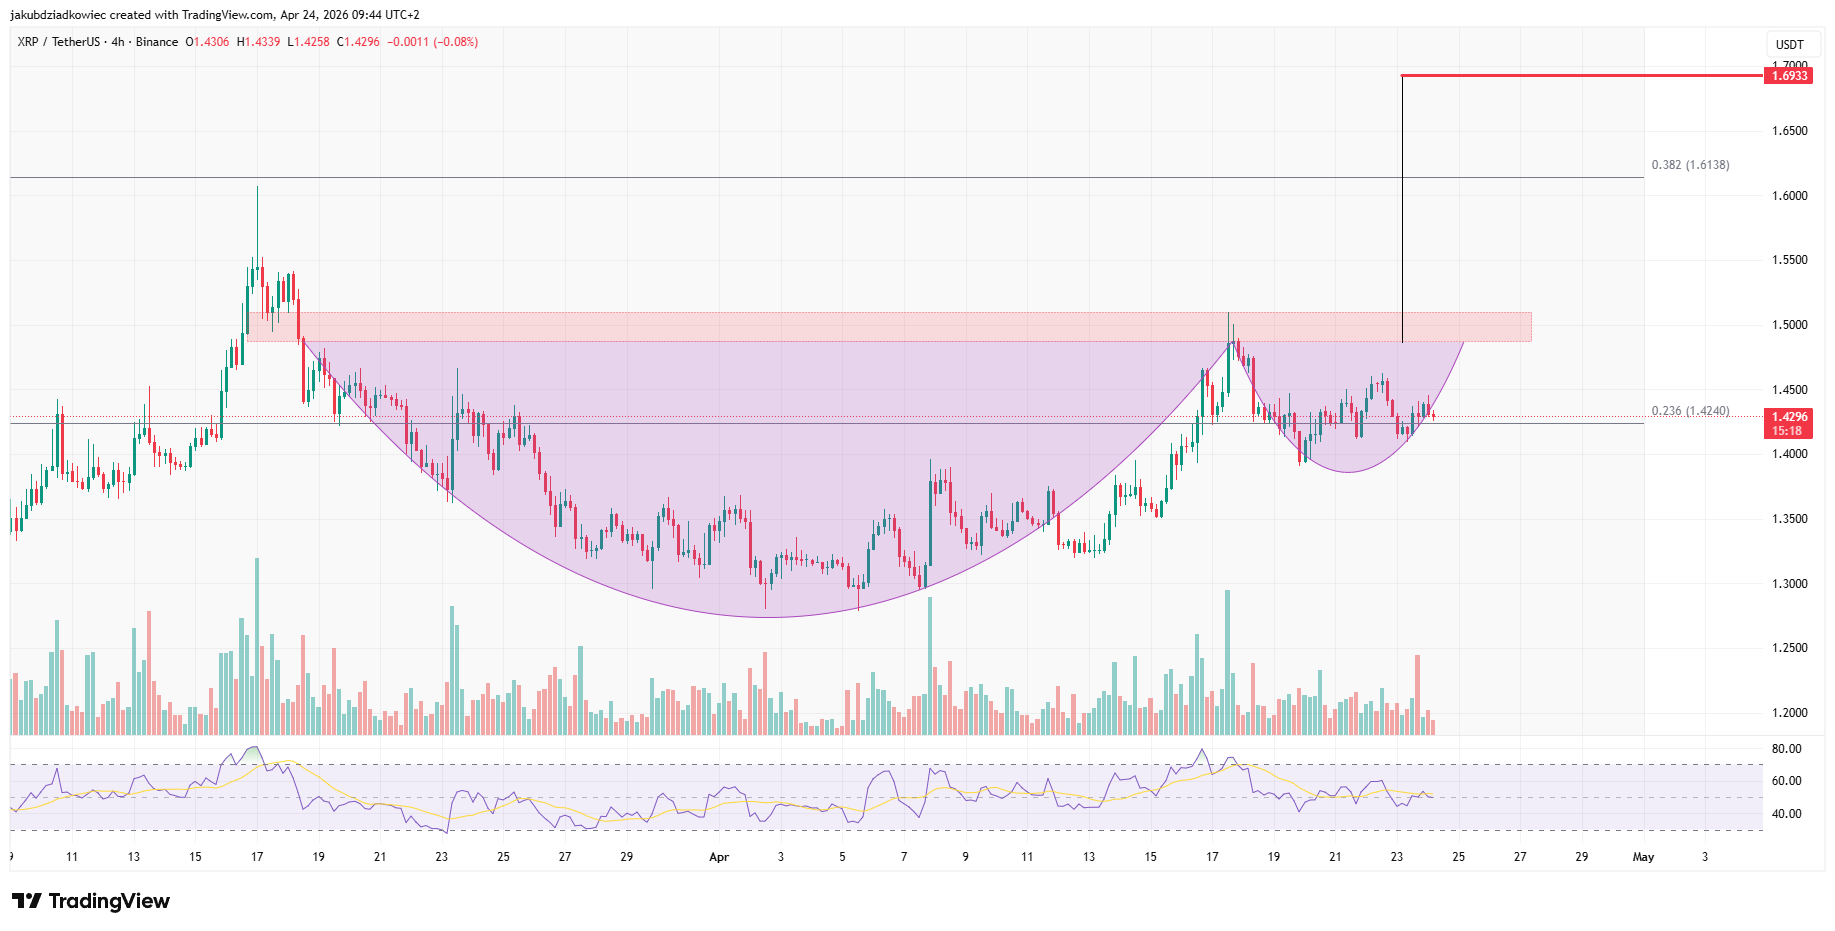
The 4-hour XRP/USDT chart on Binance shows a cup and handle formation taking shape. The cup stretches from the March low near $1.30 to the April peak at $1.50. The handle is forming right on the 0.236 Fibonacci line at $1.42.
A clean break above the $1.50 neckline measures to a target of $1.6933. That target sits between the 0.382 and 0.5 Fibonacci retracements of the recent leg down. It represents roughly 18% upside from current levels.
The 4-hour RSI sits near 50, matching the neutral momentum seen on higher timeframes. That reading aligns with a late-stage accumulation pattern rather than exhaustion.
If $1.30 gives way before the breakout, the cup and handle get invalidated. Hold the $1.30 floor, and the alignment across weekly, daily, and 4-hour charts favors a breakout.