
The US stock market pushed higher on April 15, with the S&P 500 briefly hitting 7,000. That level has not been seen since January 28. Bank earnings beat expectations, and tech extended its rally, though the Dow slipped on industrial weakness.
Three forces lifted the session. All three trace back to the same shift. The market is pricing in a resolution to the Iran conflict and positioning for the next leg of 2026.
1. S&P 500 Touches 7,000 as the Iran War Recovery Completes
The S&P 500 hit an intraday high of above 7,000. That marked its first time above this key psychological level since January 28. The index has now rallied roughly 11% from the March 30 low of 6,317. That move erased all losses from the Iran war. Ceasefire talks and a weakening dollar continue to fuel risk-on sentiment.
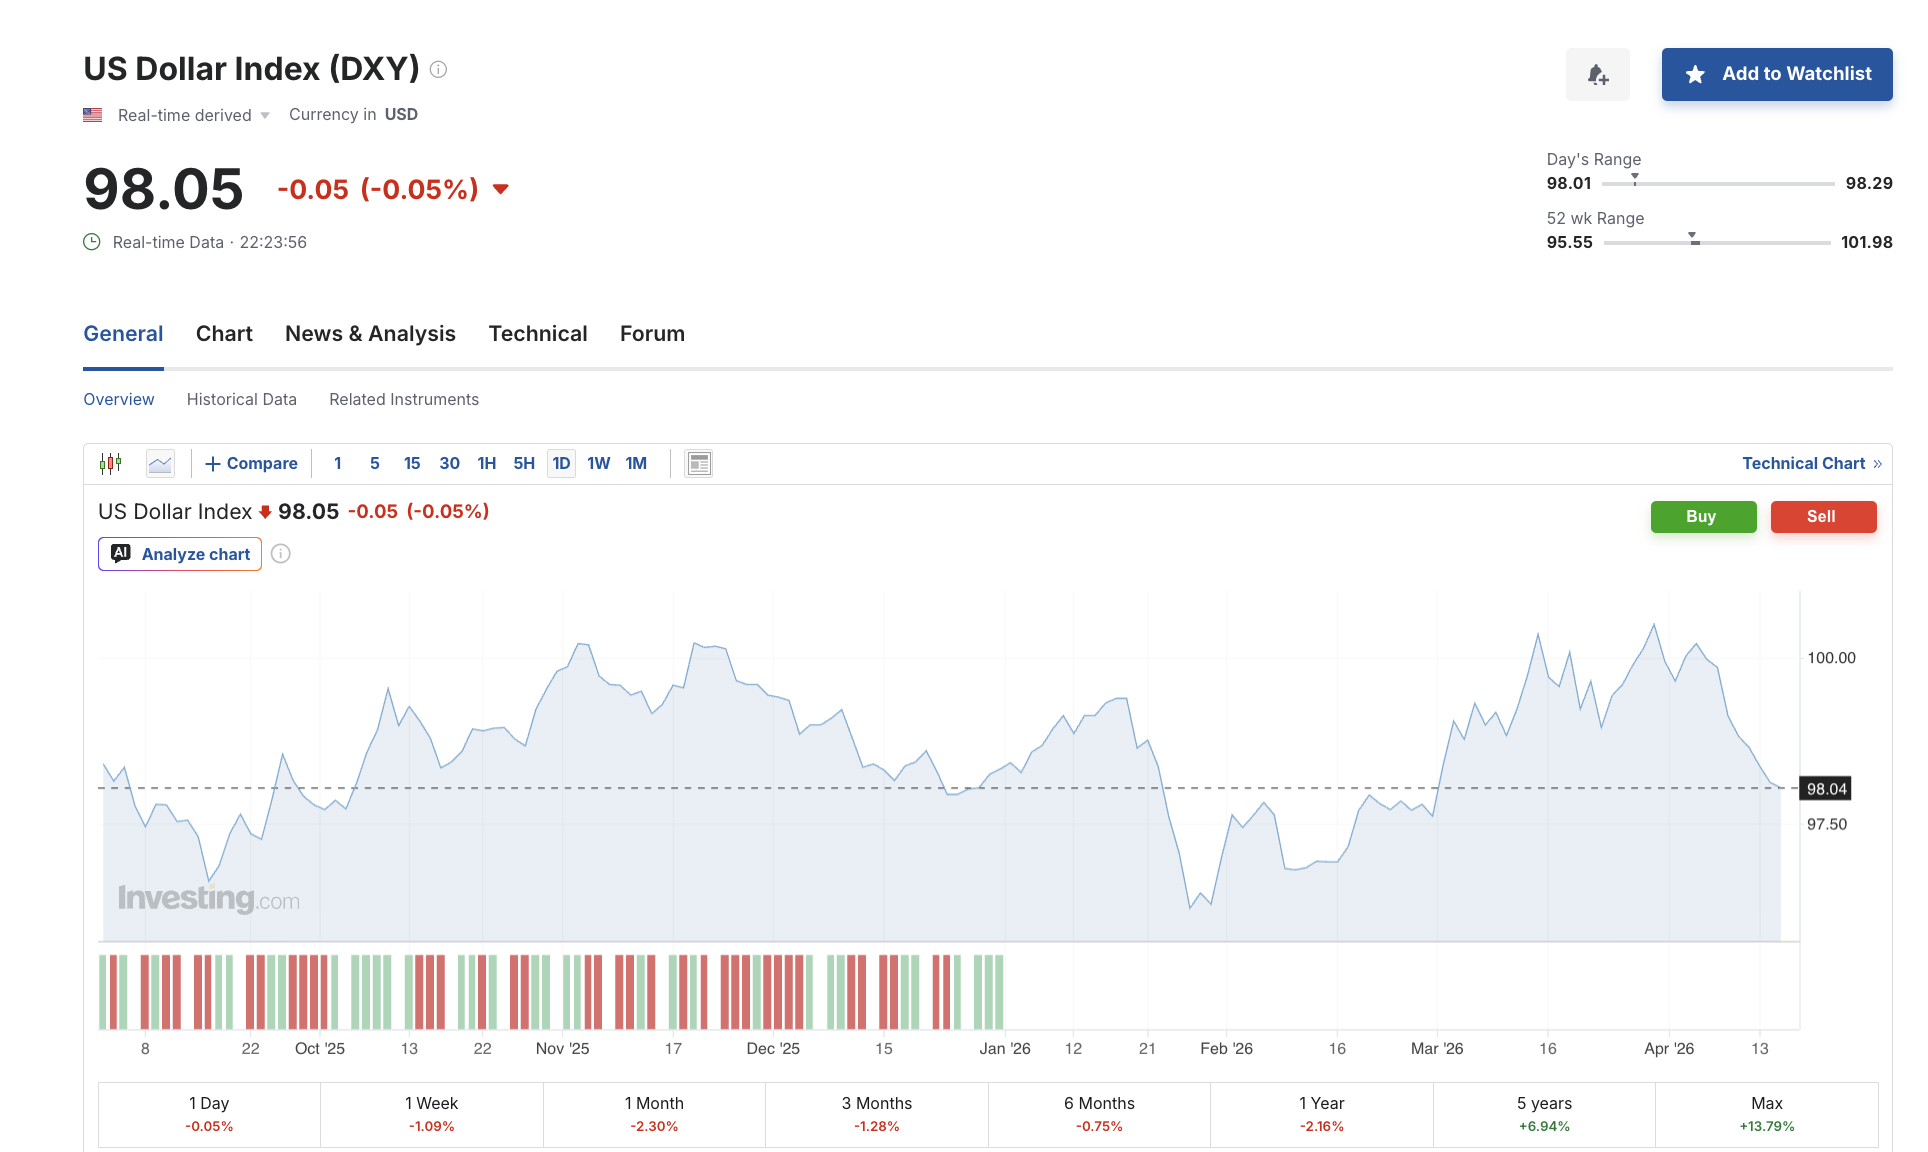
The DXY index has dipped over a percent in the last seven days, helping the risk-on sentiment.
2. Bank Earnings Confirm a Resilient Economy
Bank of America (BAC) rose after reporting a Q1 profit beat. Sales and trading revenue grew roughly 12%, driving the results. Morgan Stanley (MS) advanced on record quarterly revenue that exceeded estimates.
Despite the geopolitical uncertainty, both results point to healthy consumer spending and active capital markets, another reason why the US stock market continues to rally towards its all-time high.
3. Nasdaq Posts Its Strongest 11-Day Run in History
The Nasdaq Composite gained 1.02%, extending what is on pace to be its best 11-day stretch on record.
Apple (AAPL) rose 2.41%. Microsoft (MSFT) added 4.03%. Tesla (TSLA) surged 7.51%. Broad participation across growth sectors shows that the rally is widening beyond semiconductors alone.
What Happened to Major US Indexes?
At press time, the market is split. Two major indexes gained while one slipped.
- S&P 500 gained 27.45 points (+0.39%) to 6,994.83
- Nasdaq Composite rose 240.68 points (+1.02%) to 23,879.80
- Dow Jones Industrial Average fell 197.90 points (−0.41%) to 48,338.10
Note: The Dow slipped as its heavier weighting toward industrials and rate-sensitive financials offset the tech-led gains that carried the S&P 500 and Nasdaq higher.
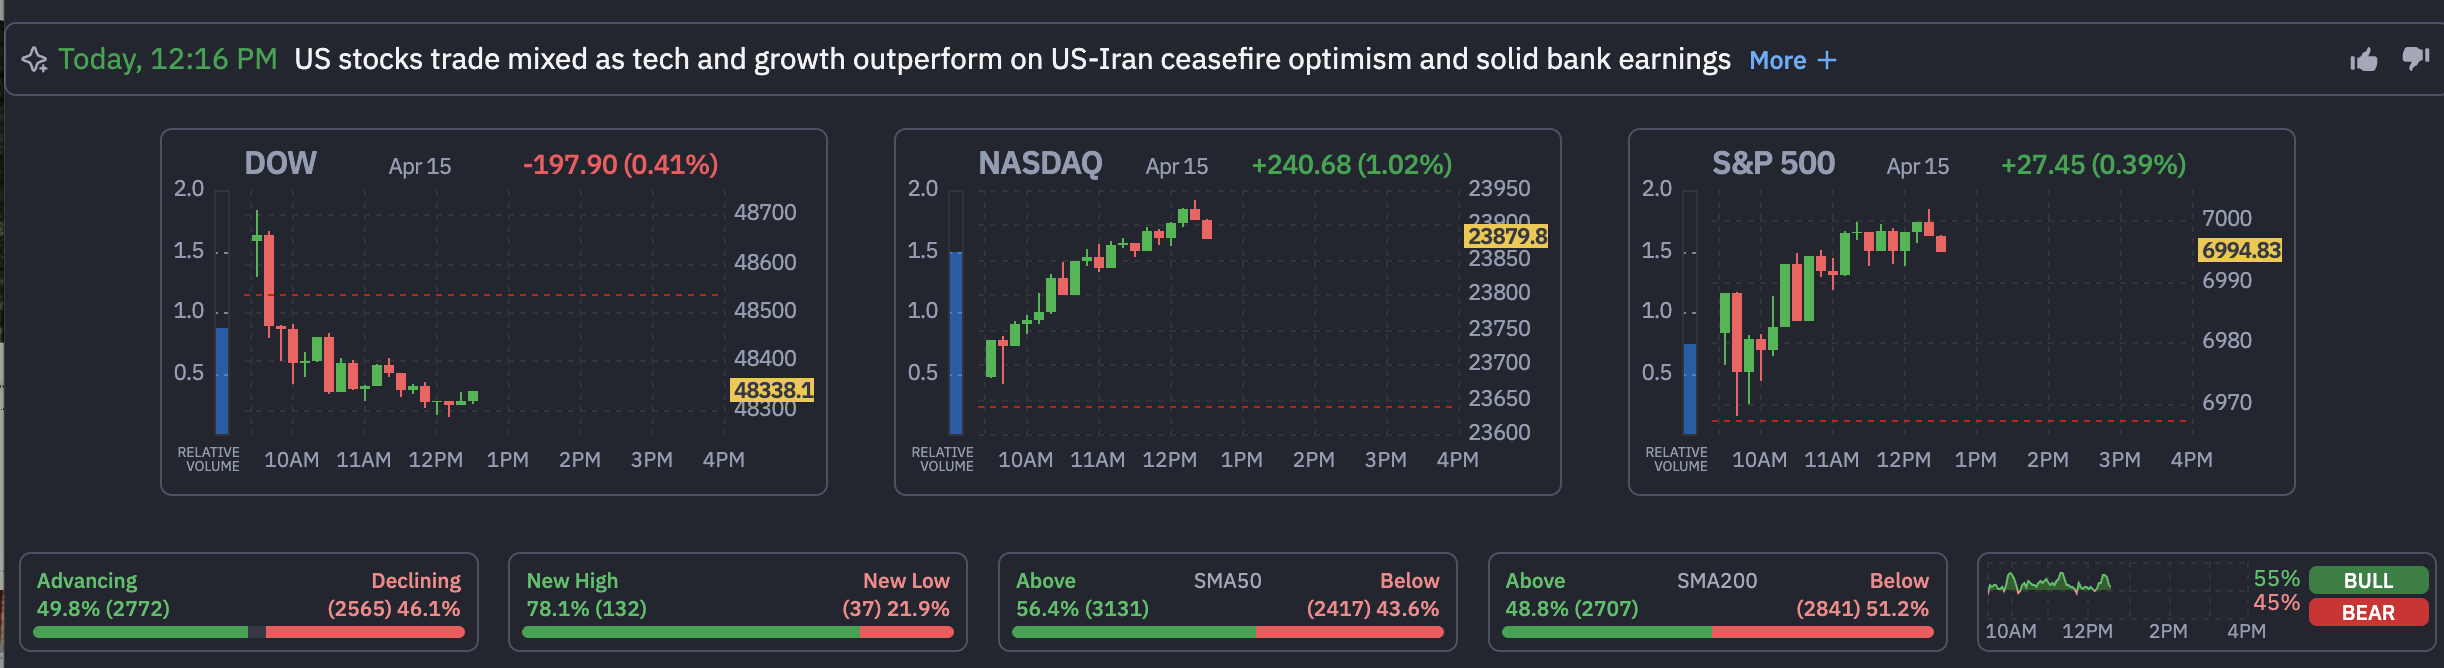
Yet market breadth leaned only slightly positive. Advancers made up 49.8% of issues while decliners accounted for 46.1%. New highs outnumbered new lows by roughly 3.5 to 1, with 132 new highs against 37 new lows. About 56.4% of stocks traded above their 50-day Simple Moving Average (SMA), a trend indicator that smooths price data by averaging closing prices over a set period.
The S&P 500 daily chart shows the index trading above all three key SMAs. The 50-day SMA sits at 6,761, the 100-day at 6,813, and the 200-day at 6,674. Trading above all three confirms the uptrend from the March 30 low.
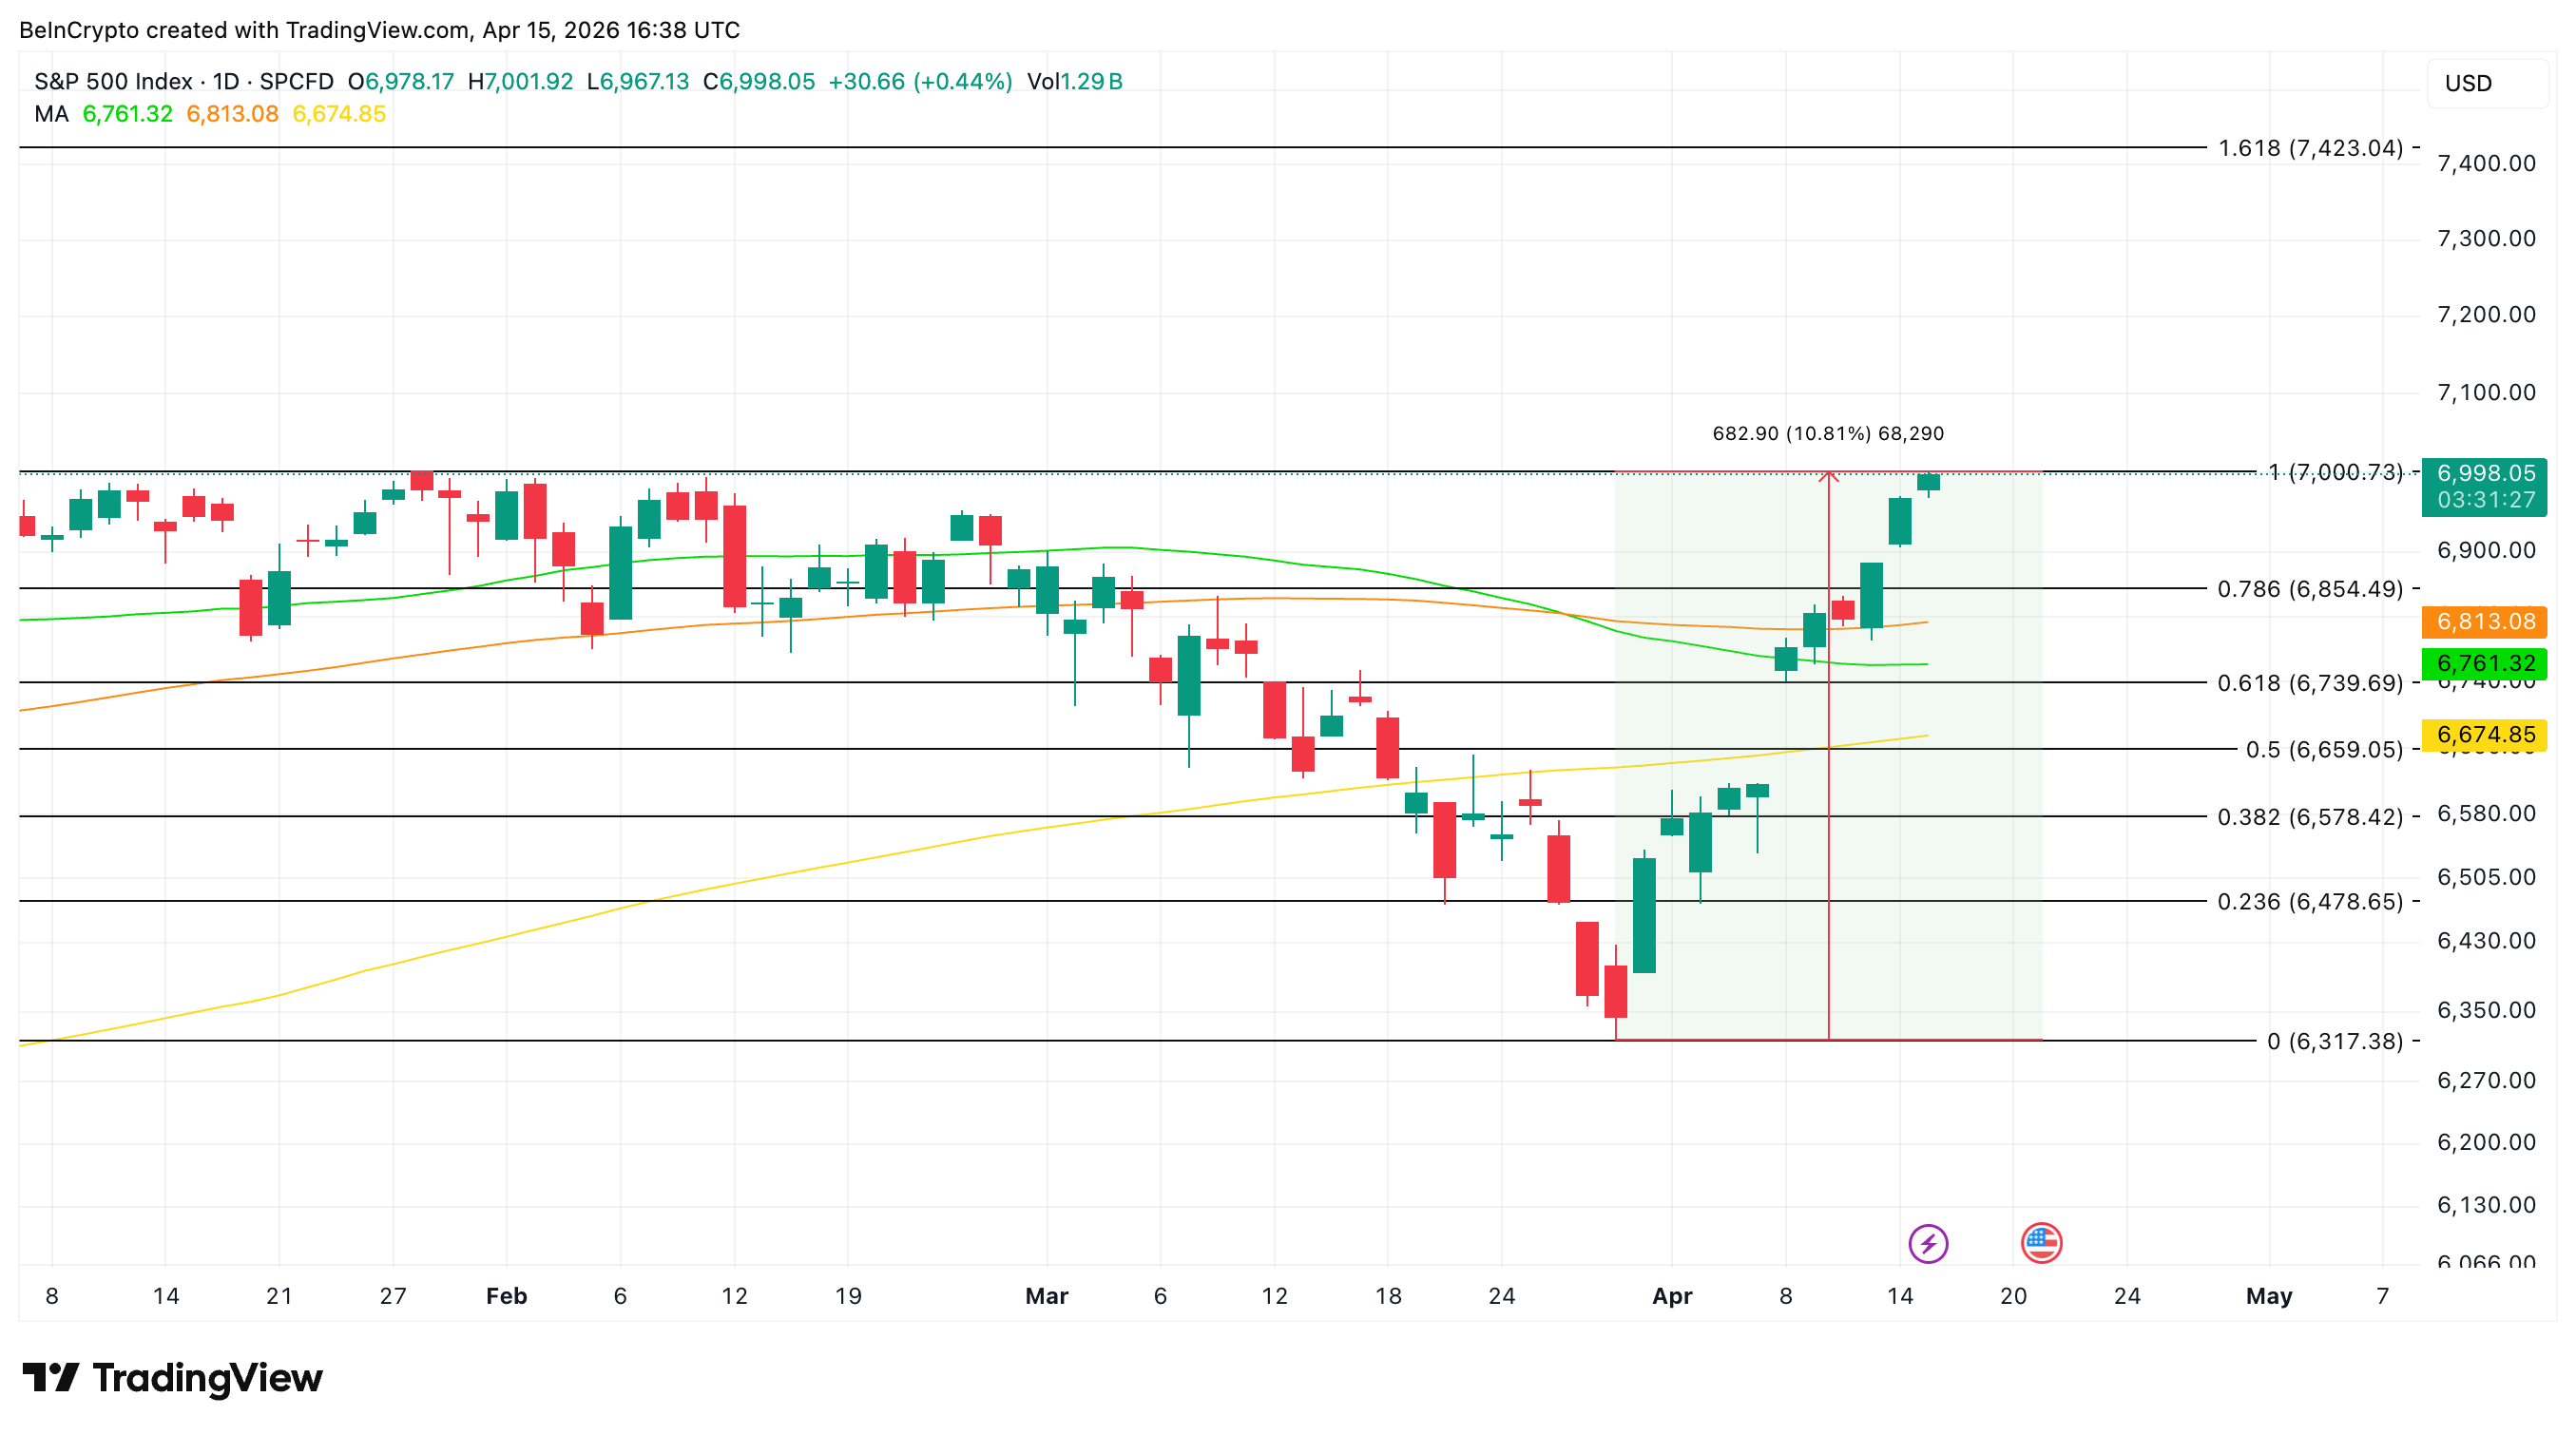
The index briefly tagged the 7,000 zone. A daily close above that opens a measured move target of 7,423. However, a rejection at 7,000 would find first support at 6,854. Below that, 6,739 acts as the next floor.
Which Sectors Are Holding Up?
Technology led with +1.35%. Apple, Microsoft, and on discretionary spending.
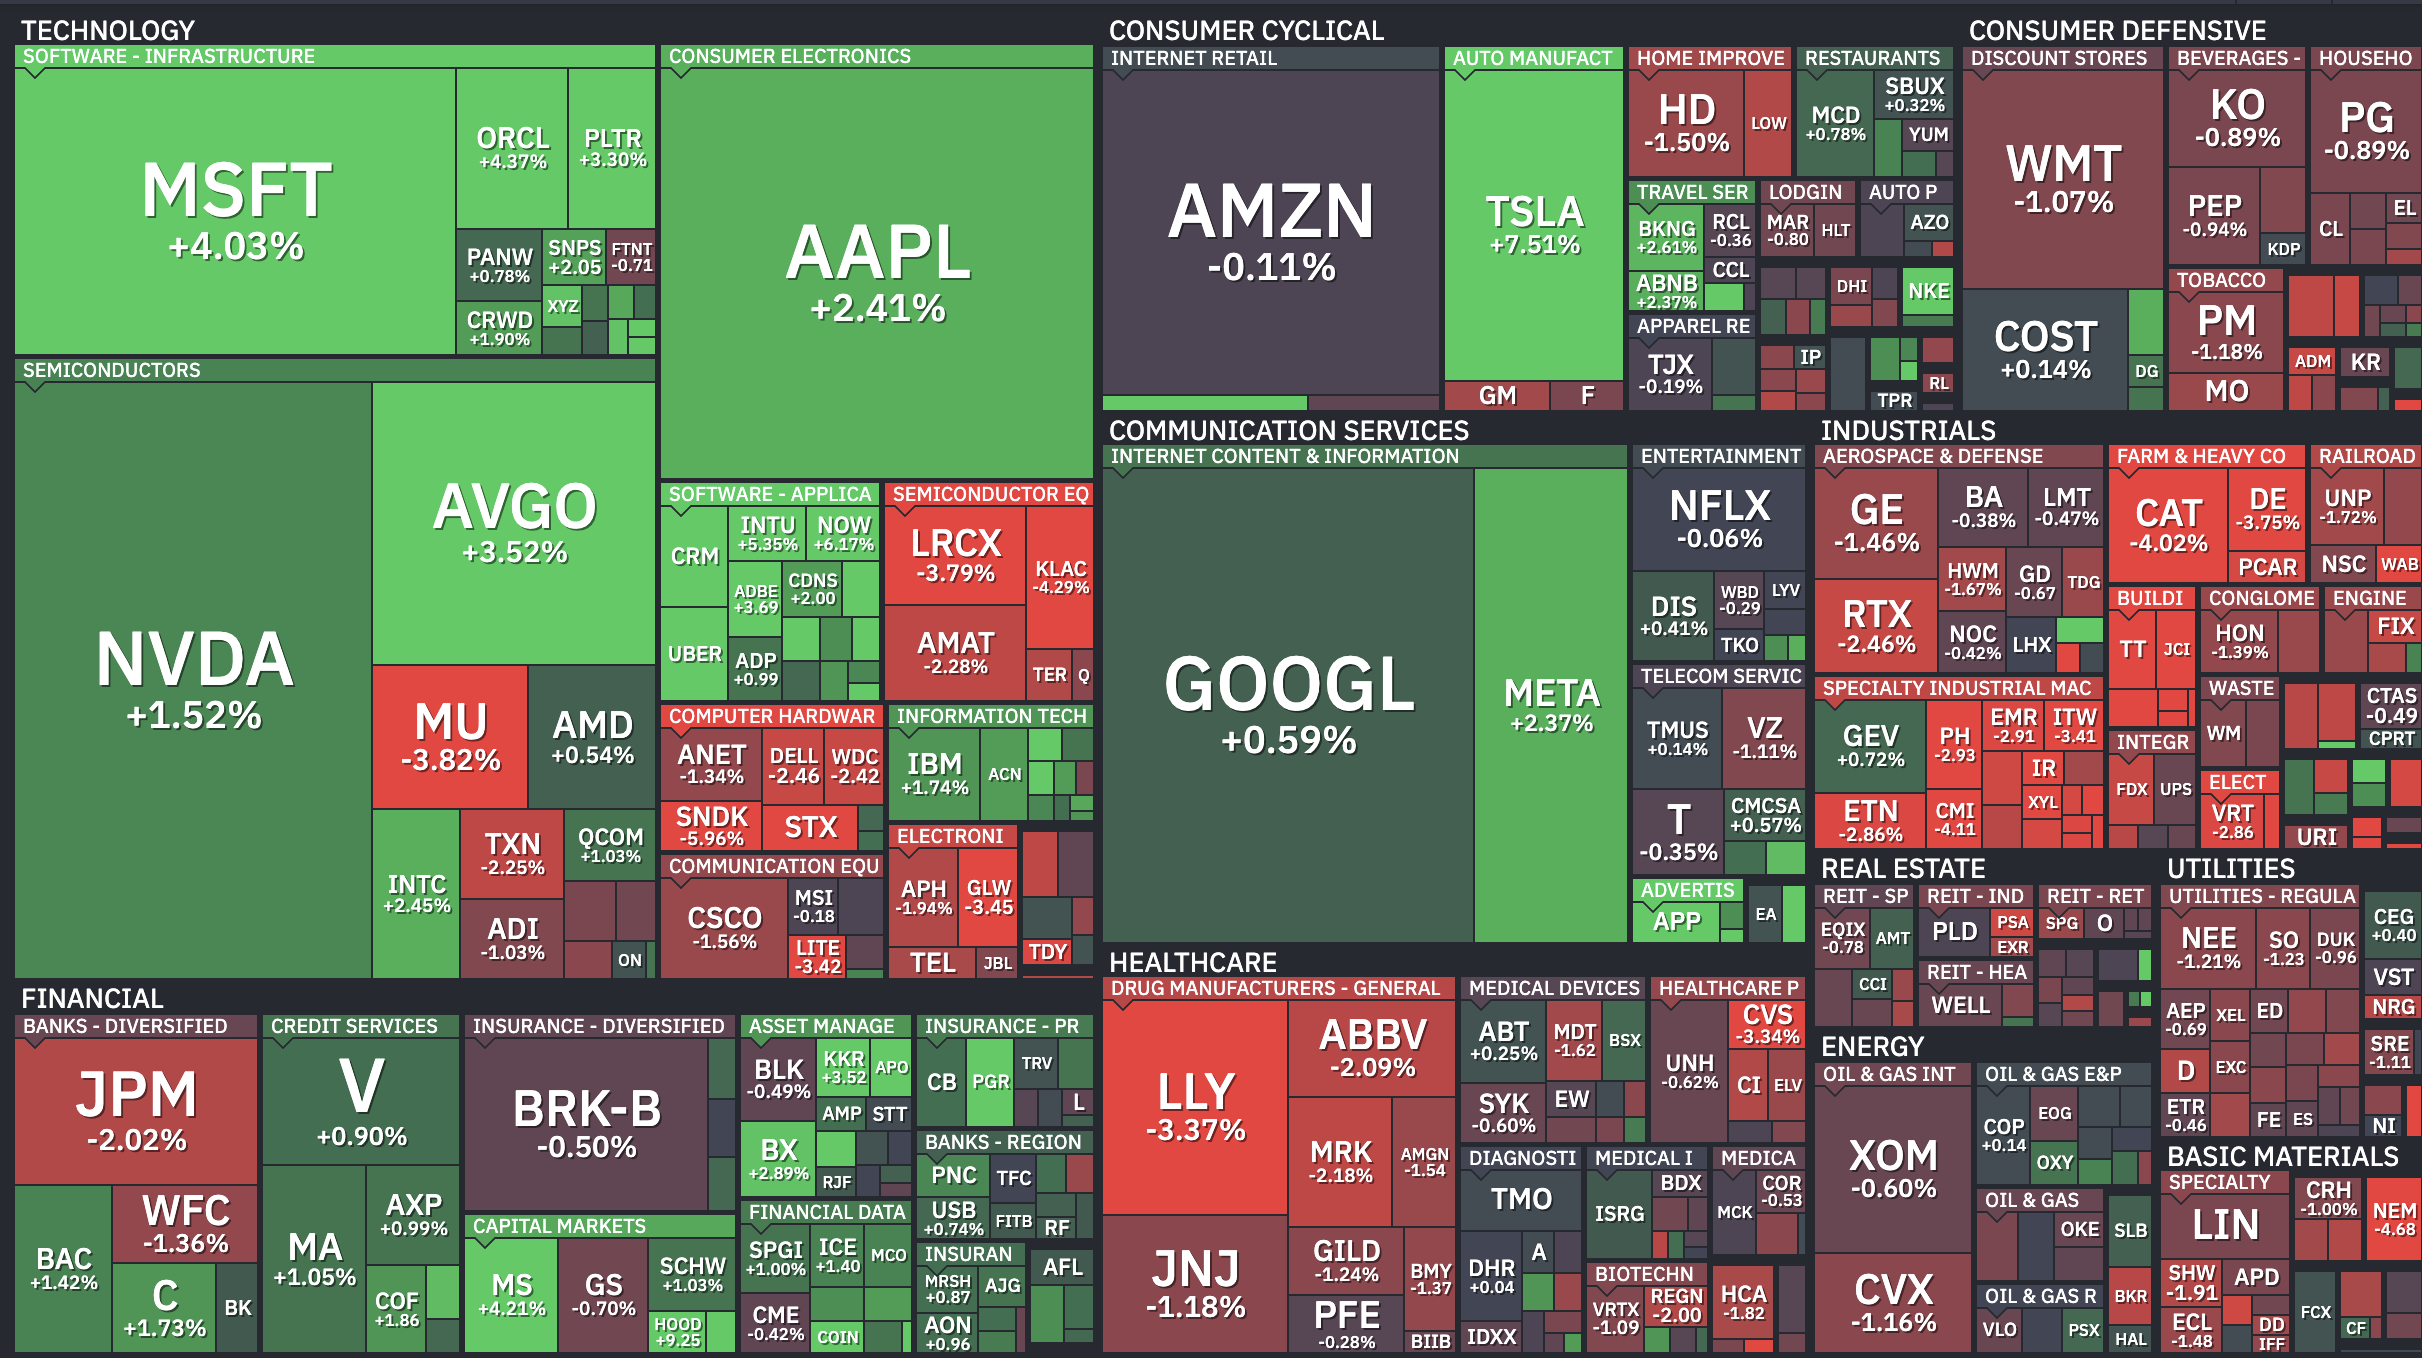
Communication Services gained +1.00%. Meta (META) rose 2.37% and Google (GOOGL) added 0.59%. Both benefit from the broader rotation into growth names.
Which Sectors Are Falling?
Industrials led losses at −1.66%. Caterpillar (CAT) fell 4.02% and Deere (DE) dropped 3.75%. Higher input costs and global trade uncertainty weigh on heavy machinery makers.
Meanwhile, Healthcare declined −1.05%. Eli Lilly (LLY) fell 3.37% while AbbVie (ABBV) dropped 2.09%. Capital continues to rotate away from defensives into growth and cyclicals.
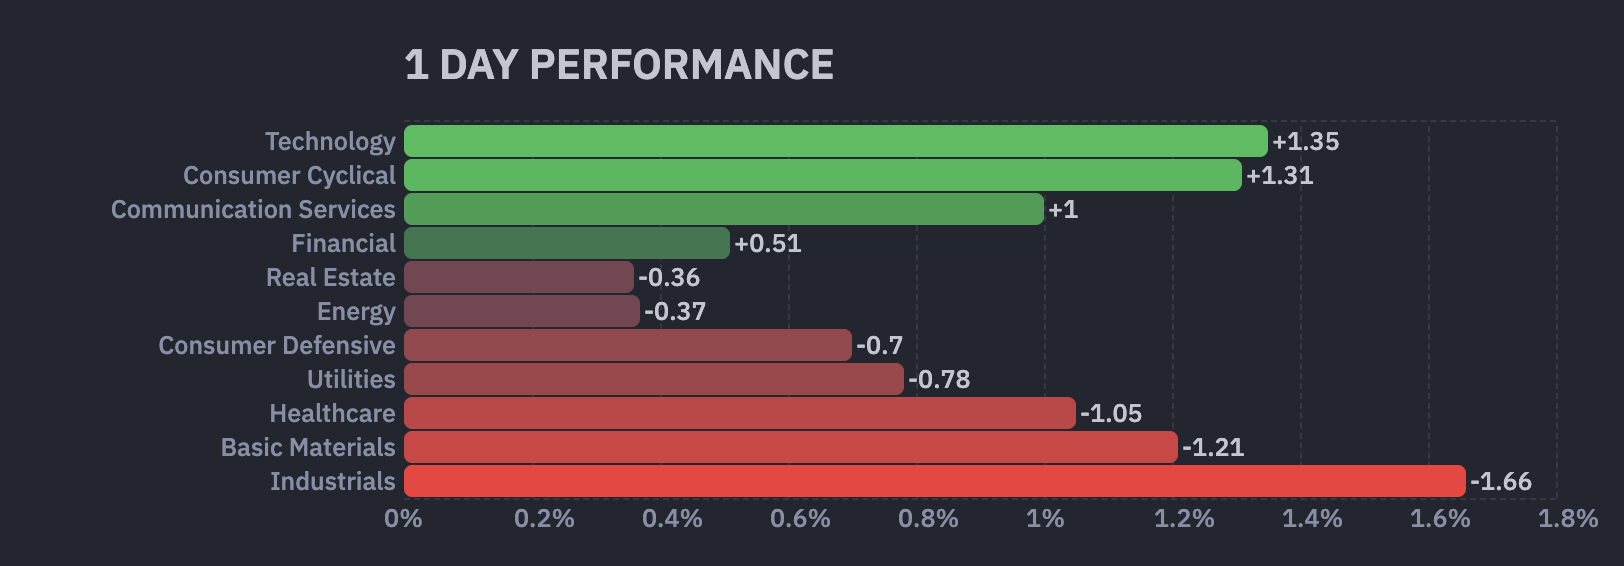
Basic Materials fell despite strong precious metals prices. The decline reflects profit-taking after last week’s rally rather than a fundamental shift.
Major Stock News Investors Are Watching
Morgan Stanley (MS) surged over 4% after posting record first-quarter revenue that beat estimates on strong equities trading. The results reinforced the view that the US economy remains resilient.
In contrast, ASML (ASML) traded lower, down 6% at press time, after issuing guidance that fell short of expectations. Even in the AI chip sector, execution risks remain at premium valuations.
What Are Investors Watching Next?
The S&P 500 at 7,000 is the immediate test. A daily close above that would mark a new all-time high. It would also confirm the Iran war selloff has been fully reversed.
Meanwhile, developments on the US-Iran blockade and any second round of Islamabad talks will set the tone for risk sentiment. The FOMC meeting on April 28-29 remains the next macro catalyst.
Markets are watching whether the Fed views the recent PPI-driven inflation cooldown as enough to shift its stance.